Seems a simple enough exercise, but how many actually do it? Did you know that Google AdWords allows you to schedule and automate your campaigns throughout the week? Not only to schedule days and hours within which your campaigns should run, but also to schedule Cost Per Click increases/decreases and budget increases/decreases for specific days and hours.
It’s often the case that those new to AdWords switch on their campaigns at the default setting, which is to run campaigns 24/7.
So what benefits are there to scheduling your AdWords?
We’re sure there are many, but the two we highlight as being amongst the most important:
1. Cost Saving – You can switch off your ads (or reduce CPC / Budgets) during days and hours when you know conversion potential is at its lowest. For instance, if you know bounce rate increases significantly between 9am and lunchtime, why not reduce your AdWords spend at that time?
2. Conversion Opportunity – As well as lowering costs when Ads are not performing, you can look to increase CPC / Budgets at times when you know conversion is most likely. Essentially you can move budget from low performing times of day, to focus on times with more potential. For instance, is your service the sort of service people investigate / enquire about on their way home from work? If so, why not increase exposure of your campaign at that time then?
Creating a Google Analytics Report to view AdWords performance by hour
You can find this sort of hourly data, and more, using the Custom Reports tool within Google Analytics. If you’re not familiar with Custom Reports, don’t worry. Rather than explain how to set it all up manually, we’ve setup the report in such a way that you can click on the link below and it will auto install in your account, using your own data. Just make sure you are logged in to your Analytics account before clicking, or it won’t work.
Download Custom Report: AdWords Conversion Broken down by Hour:
https://www.google.com/analytics/web/permalink?uid=gbUFv9yCQ9O55OkddJ5v_Q
A couple of points:
1. If you don’t have any AdWords data within your Analytics account (i.e. if you’ve never run AdWords), then the report won’t show any data.
2. The report is setup specifically to look at Goal Conversion from AdWords, so if you have no Goals setup, the report won’t show any data.
3. If you do have goals setup, you’ll need to make one small tweak to the report once installed. Visit the report and press ‘Edit’ at the top of the page (just under the report heading). Within the “Metrics Groups” section of the setup, you’ll see 4 blue boxes, 2 of which are goal related. One relates to Goal Completions, the other to Goal Conversions. You’ll need to change these to your specific Goal number (the default Goal number in the above link is Goal 8).

Viewing the Custom Reports

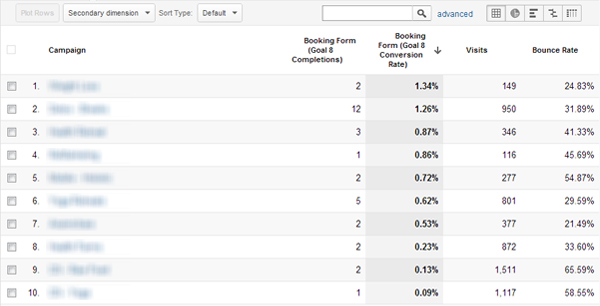
The screenshot above shows step 1 of this Custom Report, showing all AdWords Campaigns for a specific goal (in this case, a booking form) broken down by Goal Completions, Goal Conversion Rate, Visits and Bounce Rate.
The report can be ordered by each of the columns. Total completions isn’t always the best column to give you most insight. For instance, if we order the report by Conversion Rate, the campaign with the highest conversion rate isn’t actually the one driving most leads. Traffic from this campaign is significantly lower than others, so perhaps there is opportunity to give this campaign more exposure to generate more traffic, knowing it will convert better. We can also see that it has one of the lowest bounce rates of all the campaigns, so something in the setup (keywords, ads, page content) is working.
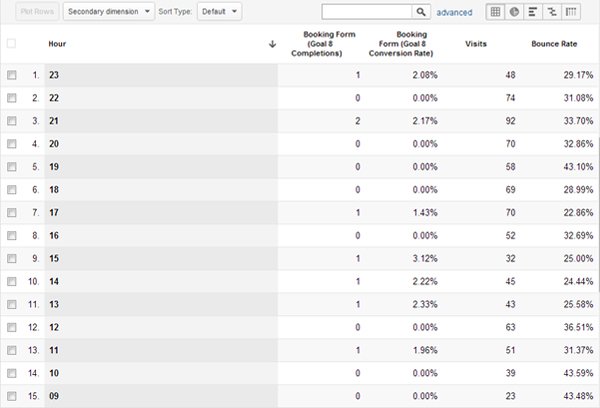
To view each campaign broken down by hourly performance, click on any of the campaigns. In the screenshot below, we’ve clicked on the campaign that was generating most Goal completions.

You can now see similar stats as above (goal completions, goal conversion rate, visits and bounce rate) for this specific campaign, for your chosen goal, broken down by hour of day. The activity within each hour is cumulative over the report time frame you’ve chosen. The longer the reporting time, the more of a trend you are likely to see.
You can start to see which hours generally encourage more visits, high bounce rates, higher conversion rates etc.
Using this data, you can now better analyse your AdWords campaign setup to account for timeframes where budget could be saved and timeframes where there are more opportunities to generate conversions.