-
Google Analytics Cost Analysis: Are You Spending Too Much?
31st July 2015
Using Google Analytics, it’s easy to be impressed when seeing your website getting high volumes of traffic, lots of conversions, and people visiting your site from all over the internet, whether it be organic, paid, social, email or other.
When push comes to shove though, you need to know how much all of those channels are actually costing you, and more importantly, how much you’re really getting in return for that cost. This is where the little used Cost Analysis Report in Google Analytics shines. It can provide you a report on all that you spend, everything you earn, and how effective each of those costs really is for your business.
Why should I use the Cost Analysis Report?
The Cost Analysis Report compares the benefits for each campaign you have running or each channel you are using, drawing a comparison between the input (financial cost / time cost to you) against the output (revenue / conversions). Revenue reported and conversions are determined by data from goals and/or e-commerce tracking, if you have them correctly setup within Google Analytics.
With this information, you can see how well each campaign or channel truly performs, in terms of time taken and cost versus any returns. It can be an eye opener and much needed nudge towards improving budget allocation, to save money or improve your return on investment.
Perhaps the biggest value from the Cost Analysis reports is being able attach values for analysis to sources that may not directly cost you money. For example, posting on social media, writing blog content, setting up email campaigns, building links for organic search. In all such cases, the main cost is time. Yet the time you spend on those items is time you are potentially not earning money.
If, for example, you spend 7 hours per week creating content for Twitter, Facebook and blog campaigns, then using a chosen cost per hour, you can calculate how much that 7hrs has cost you. This cost can then be included in a document and uploaded to Google Analytics. You’ll then be able to better measure whether Twitter, Facebook and blogging are worth the time that you are spending creating such content.
Inside the Report
The Cost Analysis report itself contains a list of sources/mediums of your campaigns, and then offers metrics to refine your data (which can be of course, chosen to suit your own needs). Some of these are:
- Cost (Overall Cost)
- Impressions (How many times your Ad was shown)
- CTR (Click Through Rate)
- CPC (Cost per Click)
- Clicks (Number of Clicks)
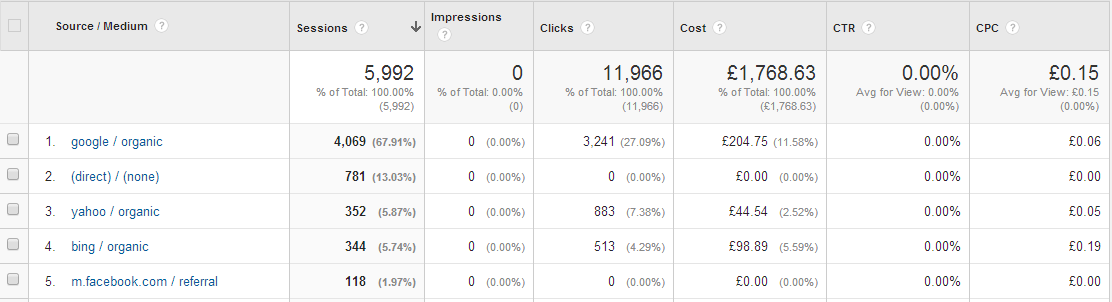
It is easy to see just how much you spend, and earn in return.
With this data, you can calculate your ROAS (Return on Ad Spend), and RPC (Revenue per Click) to see whether or not what you are spending on each campaign is really worth it.
If the data directly in the reports doesn’t answer your questions, you can also build your own Custom Reports, pulling in data from your uploaded document, allowing you to compare channels and costs with multiple other metrics (specific goals, bounce rates, time on site etc).
Multiple sources and multiple uploads
Google will try and pull in such cost information from other Google sources (AdWords costs, AdSense Revenues), but won’t pull in cost information from any external source. Google Analytics allows you to import your own cost data directly. When this feature was first released, it was quite cumbersome, as it required using the API to access and upload your data. Nowadays, it is a streamlined and easy process.
Google Analytics now allows you to create an Import Data Set, and after creating it, will give you access to a schema with which you can sort your data so that it can be uploaded. After a short while, you’ll start seeing the data in your reports. That data can include clicks, impressions and costs for multiple channels and campaigns.
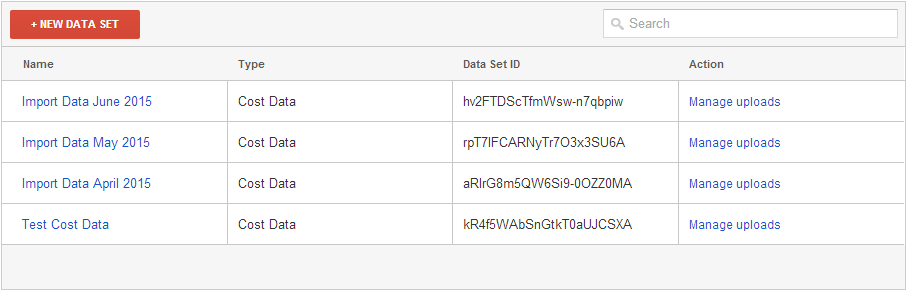
You can upload data from nearly any source into Analytics.
It’s also worth noting that you can upload historic cost information, by specifying dates for data. If you have cost information from the past, and would like to compare it to performance, you can upload it and analyse.
So don’t throw your money away!
Overall, this feature is one of the most overlooked, but one of the most useful reports within Google Analytics. It can be easy to simply throw money at various campaigns, see some increases, and simply assume it costs that much. By using this Cost Analysis report, and drilling down just a little, you can truly see if you are getting your money’s worth.
Let us know about your own uses of the Cost Analysis report, or anything else you would like to learn about in the world of Google Analytics, in the comments below.