There are a lot of great tutorials and guides out there on the web to help you learn about the many features of Google Analytics, but they can sometimes lack a realistic approach. Great descriptions of the features, but less information on how you can actually apply your new knowledge to start improving your business.
To that end, we thought we’d offer 3 useful things you can do in Google Analytics, and how you can apply them.
1. Discover your top content with Pages & Landing Page Reports
Perhaps you write a weekly blog post? Perhaps you have specific landing pages built for key services? Perhaps you’ve taken time to write descriptions for products?
Do you know which of those pages are keeping people on the site? Or which pages are driving newsletter signups? Or which pages are causing people to leave?
It’s important to gather some data to help you with your content improvement.
Google Analytics provides a few reports about page performance, including the All Pages report (Behaviour > Site Content > All Pages) and the Landing Pages report (Behaviour > Site Content > Landing Pages), offering some useful metrics, such as:
- Bounce Rates: How many people are leaving without looking at a 2nd page? If it’s high, does that indicate a problem with the page?
- Average Time on Page: Are users spending enough time on the page to have actually read all the content? Have you timed yourself reading that content?
- Exit Rates: Are certain pages more likely to cause people to leave?
- Conversions: Which pages contribute to your goals and conversions, such as enquiry forms or click to calls?
These metrics allow you to test changes to your content. If the metrics aren’t what you expected, then perhaps it’s worth considering some / all of the following:
- Rethinking the intro title on the page
- Making the content easier to read (more paragraphs, more sub-headings)
- Improving the quality / placement / content of images
- Making internal links more obvious within content
Start a page content improvement plan, by using useful metrics in the pages report, deciding which pages to focus on, implement some changes, then relook at metrics to see if they’ve improved.
2. Find out what screen sizes your users are using most often
We’re not just talking desktop v mobile. We’re talking actual screen sizes. There are a huge number of different devices out there, and those devices come in all shapes and sizes.
Are you sure your website displays / functions correctly on all of them? Do you even know which sizes are most commonly used to browse your site? Google Analytics has a screen size report, to help you understand just that. (Audience > Technology > Browser > Screen Resolution).
This report can be great for finding potential issues that you might not otherwise know about, and lets you move on make improvements to correct. For example:
- Fewer transactions at a particular screen resolution: Is there an issue with the checkout, or basket, at that screen size? Do the buttons disappear? Are the checkout fields harder to complete?
- Higher bounce rates at a particular screen resolution: Are your images displaying properly? What about the text? Some content might not display correctly at a certain resolution, making the website look broken and causing users to immediately leave.
- Fewer Form fills at a particular screen resolution: Do your forms resize on different screen sizes? Does that make them easier / harder to complete? Do some form CTAs disappear at specific sizes, stopping people submitting?
Load up the Screen Sizes report for your website and see if you can spot variances on Bounce Rates etc. Note down those with obvious differences, and go test your website on those screen sizes to understand if there are issues.
3. What are users searching for on your site?
A lot of websites have an onsite search function (usually a magnifying glass in the header), which is a handy tool for letting visitors quickly find the content they are looking for. Many people assume it’s used a lot, but don’t actually track how it’s used or how it impacts performance.
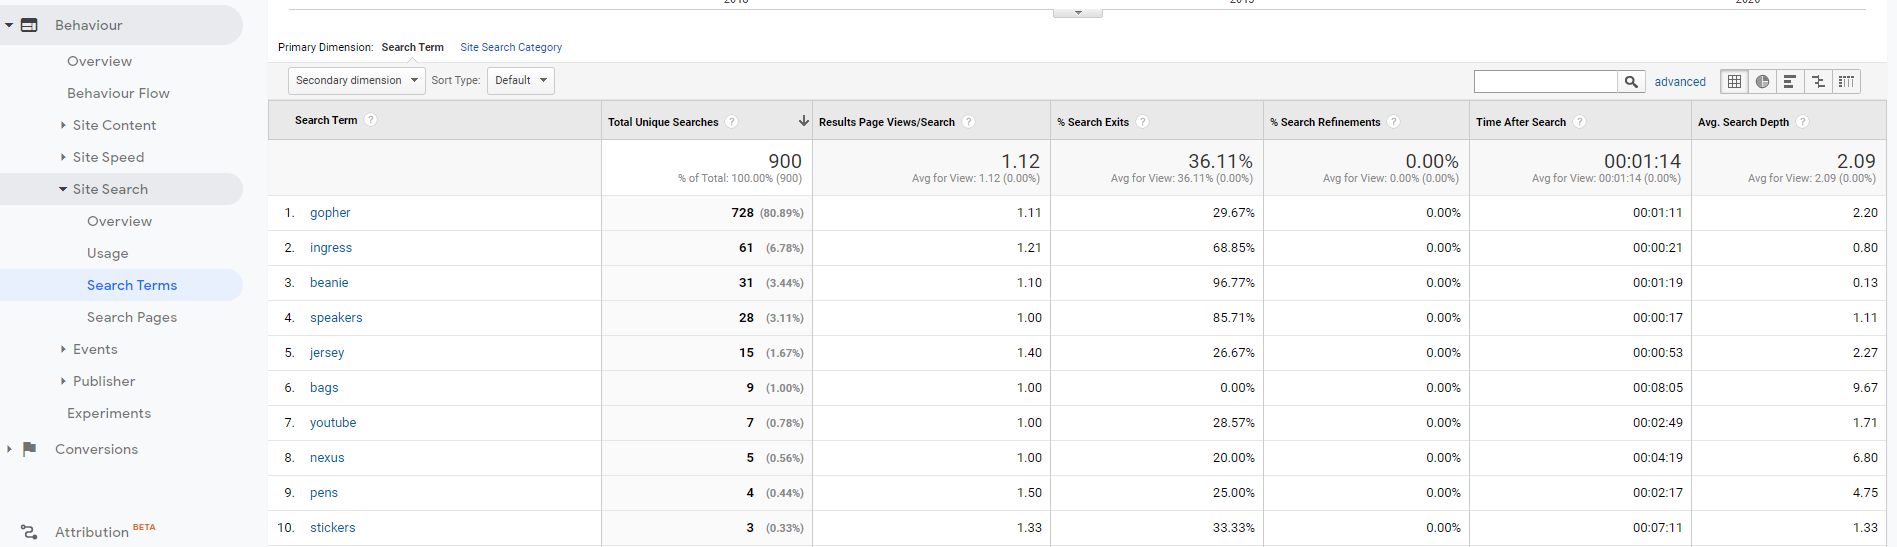
Google Analytics offers an often overlooked Site Search report (Behaviour > Site Search). It’s fairly easy to setup in most cases, and can be a treasure trove of information for developing the content of your website, simply by helping you understand how that search box is used.
The key report in this section is “Search Terms”. This report lets you see what users type into that search box, how often terms are searched for, which cause people to leave the site, and which encourage people to stay. This can go a long way to help you understand your visitors and can raises some key questions:
- If users are searching for service or product names, could that indicate that your main menus and internal links aren’t clear enough?
- If users are searching for something that you don’t provide, could that lead to an expansion of services offered?
- Are your users searching for things you thought were obvious onsite? Could this be an indication that the content needs rethinking?
- Are users searching using terminology you don’t typically use to describe your services? Could that suggest re-looking at service or product descriptions?
- How do the search queries stack up to Search Console reports? Are you ranking organically for things users are searching for onsite?
Asking yourself these questions and looking through the site search report can help you understand what users are looking for when they are on your site, and ultimately help you improve the content on offer. Learning more about your users will enable you to make informed changes to your website.