It’s easy to look at AdWords day to day. In fact, for those fairly new to AdWords, the main focal point when reporting is the graph provided above the table of data. It’s easy to use because it’s a clear comparison, one day to the next, of various points of measure (CPC, CTR, Impressions etc).
In addition, it’s fairly easy to just change the date range from today, to yesterday, to the day before and so on, to see data by day.
Unfortunately user behaviour isn’t consistent through the 24hr day and, while daily & weekly viewing can provide great insight, they doesn’t give a granular breakdown that can really influence how you schedule your Ads.
In our recent “Breaking down your Paid Search Campaigns to compare hourly performance” post, we explained how to use Google Analytics Custom Reports to measure conversions from AdWords by the hour. Now we want to show you how you can view various other measurements, by hour, directly in Google AdWords.
What AdWords information can be seen by hour?
Lots! You can of course edit your column selections to see what information works when viewing reports by hour, but initially you’ll be able to see important information including Cost Per Click (CPC), Clicks, Impressions, Conversions, Average Position and more.
What’s more, you’ll probably be surprised just how much each of these changes throughout the day.
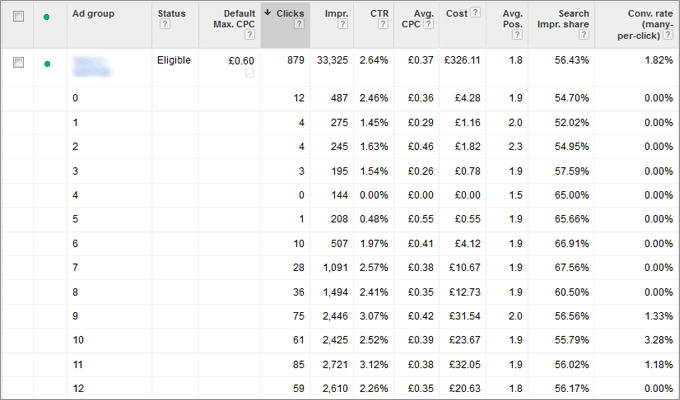
The above screen shows Cost Per Click varying between 29p to 55p, and CTR varying between 0% and 3%, on average, in the first 12 hours of the day.
Why is breaking down by hour a useful thing to do?
User behaviours change throughout the day. People go to work, have lunch, come home from work, socialise and more. Such activities influence when those users will use the internet to search, download, buy or generally interact. Knowing when such activities are most likely to happen in a 24hr day will allow you to schedule your AdWords Ads and Automate your bid strategy to target those times. In turn, this can help drive up efficiency of your campaign and improve performance.
How to access the hourly segment report in Google AdWords
Once logged in to your AdWords account, select the campaign you’d like to analyse per hour by clicking one of the campaigns in the left menu.
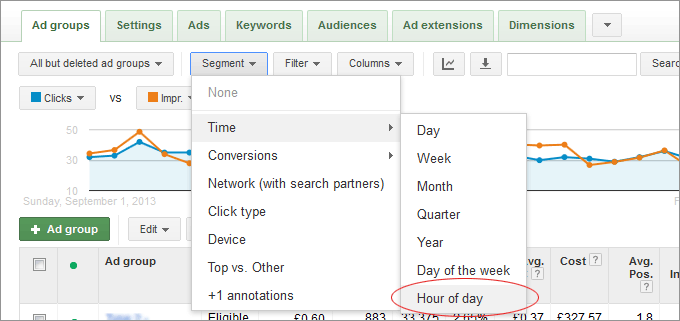
You should now see a list of AdGroups within that campaign, in the centre of the page. Click on Segments > Time > Hour of the Day. The report you’re face with should now give you a 24hr breakdown for each AdGroup within your chosen campaign.
The hourly report is not split by day. It’s cumulitave across the time scale selected. If you choose a time scale of 7 days in which to view the hourly report, then each hour is a total / average of that hour across the 7 days. For example, the 5pm data will show total clicks, total impressions, average CTR and average position for 5pm on day 1, day 2, day 3 etc combined.
What now?
Understand and test your schedules. Try targeting at peak times, while reducing CPC in hours with lower conversions. You could even get creative and write your ads to target those hours!