It’s Friday. No matter how much work we all have on, what deadlines are looming, and the various problems we’re trying to resolve before leaving for the weekend – we all suffer at least a little from that Friday feeling, where our mind wonders away from the important tasks at hand.
It could simply be caused by diminishing concentration as the day goes on, or it could be the eagerness to finish up for the weekend. Whatever the reason, distraction seems to attract us a lot more on a Friday afternoon than any other day of the working week.
Just for hoots and giggles (because it is Friday after all), we thought we’d offer you some suggestions that allow for a degree of distraction, but still allow for constructive activity during those moments where your mind desperately wants to wander.
This week’s suggestion:
Track the business promotion activities you’ve carried out (recommended time: 15 minutes)
We all promote our businesses in one form or another. As businesses, we tweet and follow on Twitter, we connect and discuss on LinkedIn, we post out PR (print and online), we like and comment on Facebook, we tweak website content, we build links to our sites, we write blog posts. Away from “online” you may even attend meetings, networking events and conferences.
Through the simple use of Google Analytics Annotations, you can log all this activity in one place and use it to compare increases / decreases in performance in a number of areas. It’s simple to use and takes very little time, and there are benefits to be gained from it.
Not only will it provide insight into the direct impact on website stats such as visit numbers and form conversions, but you’ll also be able to compare annotations with data from other reports. This is particularly useful when looking back over time.
For instance, you might have particular weeks where you know you received more phonecalls than normal, or a bigger growth in social following, or even a boost in organic search rankings. Annotations let you look back at those periods in time to identify what business activities coincided with the traffic spike, helping you draw conclusions on what future activity your business can undertake for a similar increase.
Start using Annotations
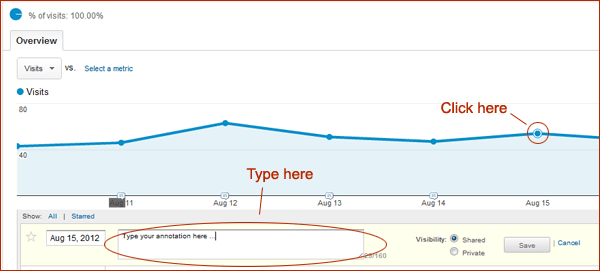
Simply login as normal to Google Analytics and visit Audience > Overview (actually, pretty much any report which shows the graph at the top will do).
Double click on any of the dots (representing days) on the graph or, alternatively, click on the downward pointing arrow that sits under the graph.

You should now see an Annotation text area. Enter some details and save. You can be as detailed as you want, as long as it fits within 160 characters. You can also choose to share the annotation with other users on your account, or to keep it private.


