Custom Reports within Google Analytics are incredibly useful for interpreting your data from raw, meaningless numbers, into productive, valuable information. While Google Analytics has a good amount of pre-defined reports that are available all the time, these display information and data in the same format each time, unless we tweak it ourselves each and every time. Creating a Custom Report is an available solution, that can save you time and energy from having to drill down into your data to find something specific.
Custom reports can be created to let you see what you desire from your data, and here are 4 reasons why you should use them!
They are tailored to your own, specific needs
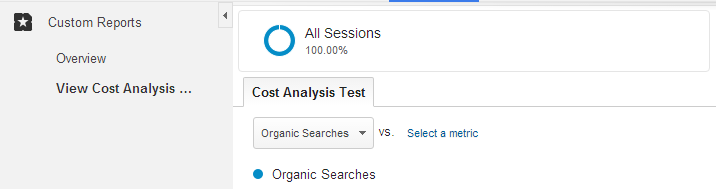
Custom Reports can be built to specification, displaying the information you need, and omitting any data that is not required from the report. This applies to everything inside of the report, including metrics, dimensions, and segments that the report uses. Standard, existing reports have their own uses, but every company and business is unique in their own way, all requiring slightly different information from their reports. Building a unique report that is perfect for your business will let you focus on the information you need. Having a Custom Report set up like this can let anyone who has access to your Google Analytics quickly obtain the correct information, even if they have little knowledge of Analytics itself, without having to dig down and dredge out the information themselves and risk obtaining incorrect data, each and every time.
You can download other reports from other people, and share your own!
One of the finest assets of Google Analytics is the ability to share Custom Reports with other people and businesses around the world. The Google Analytics Solutions Gallery has a huge selection of Custom Reports have been built and distributed to the community, of which you can also share your own, or peruse the reports to find one that could be beneficial to your own business. If setting up your own Custom Report sounds daunting, or you are not too sure what process you should apply to refine and filter your data, this resource is useful to see if a report that someone else has built could do what you require, and then tweak it yourself to suit your needs!
They have some optional display options
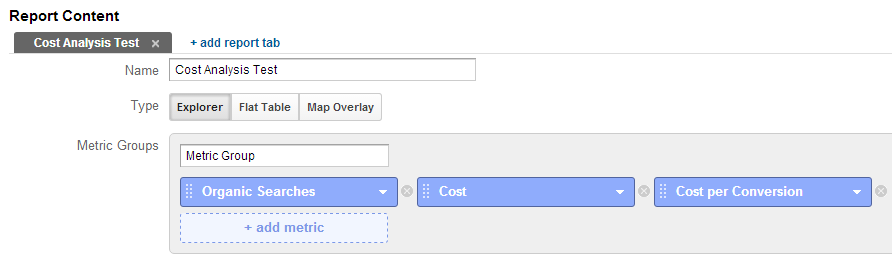
There are a few different types of Custom Reports that you can create, depending on the data that you wish to see. The default is Explorer, which Google Analytics uses for most of the existing reports, which contains a standard table of data and a line graph plotting the various values as points. There is also the Flat Table, which simply displays your information as a static table of values and data in rows. Finally, there is the Map Overlay report type, which is the most appealing to the eye. Functioning with location data, it can display a map of where you want your information from, and have the data plotted as locations and colours, to highlight strengths and weakness of the data that you have obtained.
You can use them to customise your dashboard
Want to see everything you need to know at a glance? You can add custom reports to the Google Analytics dashboard, and use them to indirectly tailor your dashboard to display all and only the information that is important to you. Any custom report can be linked to the dashboard, to make it look clean and concise to your own standards. While they have different types, as described above, Custom Reports have the same display options as the standard reports as well, and can be used to brighten up or convey your data differently. If you were doing a presentation for example, some colourful charts might make the information a little easier on the eyes, and can be done by linking your Custom Report into the dashboard directly.
Summary
Even without adding fancy display options, Custom Reports are invaluable for saving you time (and by extension, money!) by omitting data that isn’t needed from your reports, and showing you the information that you, or somebody else who needs to see it, clearly. Having a collection of Custom Reports allows you to see correlations that simply aren’t visible in the standard reports. Let us know in the comments below if you have a favourite Custom Report, or one that you found useful from the solutions gallery.