Heat maps are a powerful tool for understanding what users do on your website pages. They can show you where users click, how far they scroll, and what they look at (or ignore) when on your website.
What is a Heat Map?
A heat map is a visual representation of data where values are depicted by colour. You’ll have likely seen a heat map before, such as a representation of temperature on the weather forecast.
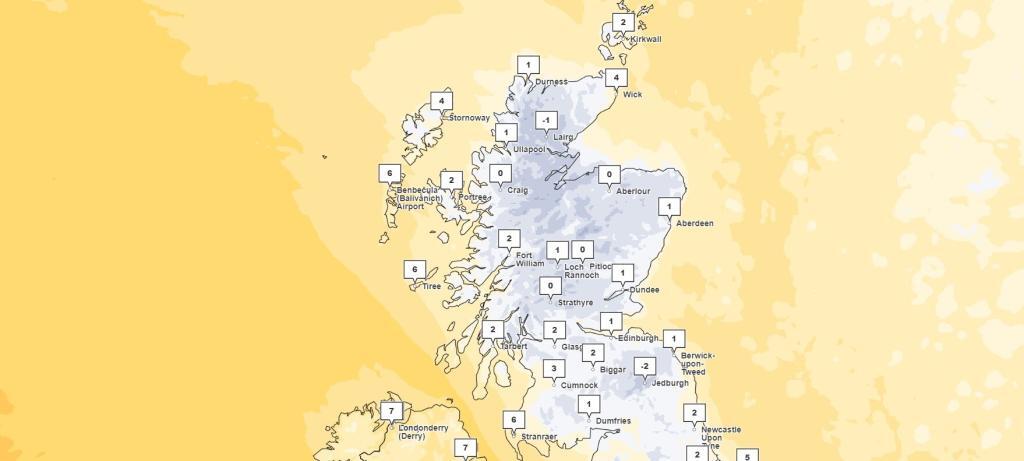
In the case of websites however, temperature is not measured. Instead, heat maps can contain values that represent the following:
- Clicks: These are where your visitors perform a click (or in the case of a mobile device, a “tap”) on your web page. Heat maps can visually show the exact position and volume of clicks. For example, you may find that your main Call To Action (CTA) or a specific service page link shows up very brightly on a heat map.
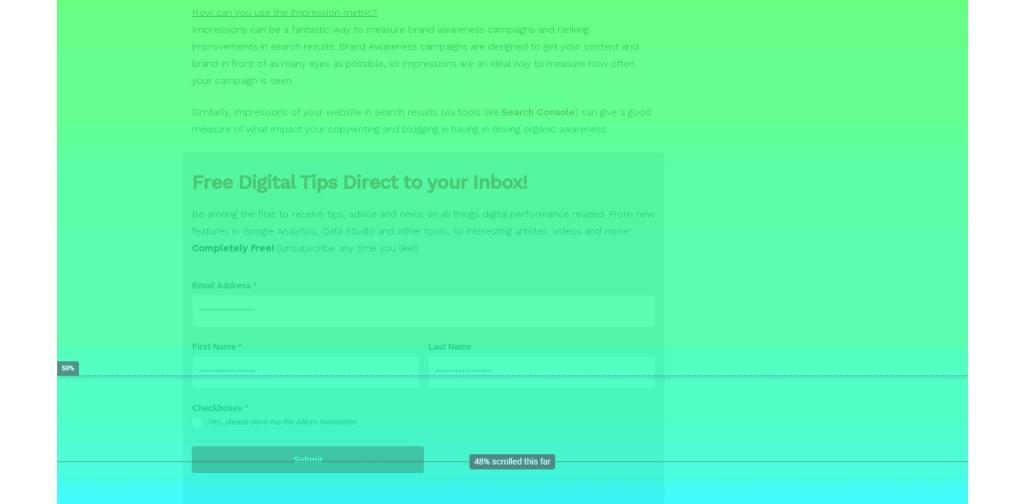
- Scroll depth: This heat map can show how far a visitor will scroll down your web page, before leaving or navigating to a different page. These usually run with the hottest area at the top, transitioning to cold towards the bottom of the page. This heat map can tell you how much of your content is being seen by your users.
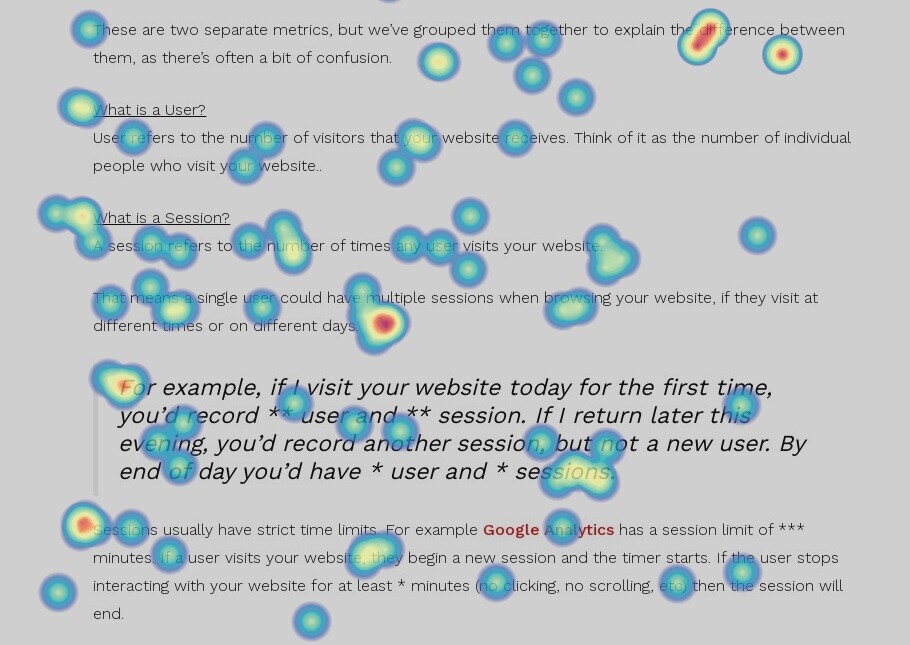
- Mouse movements and pathing: This heat map works similar to clicks, but rather than recording clicks directly, these will watch how visitors move their mouse cursor around the website. This is useful for tracking how visitors behave and find your most important content.
They are essential in detecting what works on a web page and which parts and elements of a page users engage (or don’t!) with. Heatmaps make it easy to visualise complex data and understand it intuitively at a glance. With this information, heat maps can provide valuable insights into how users interact with your website.
Heat maps can help you identify which parts of your website are most popular, which parts are being ignored, and which parts are causing confusion or frustration.
By analysing this data, you can make informed decisions about how to improve your website and increase user engagement, or simply find out which areas of your website aren’t working as you expected.
How can Heat Maps improve your website performance?
Heat maps can provide suggestions for improving website performance by highlighting areas of your website that are not performing as well as they could be. For example, if a heat map shows that users are not clicking on a particular button, you may want to consider moving the button to a more prominent location on the page.
Similarly, if a heat map shows that users are not scrolling down to see all of the content on a page, you may want to consider reorganising the content to make it more engaging. Here are some specific examples of how heat maps can improve your web page content and website performance.
1. Optimising online content
Heat maps can help you understand how users interact with your website and where they lose interest in your content. For example if your main page content is halfway down the page and only 25% of users scroll that far, perhaps it should be moved up and made more visible.
2. Improving page structure
Heat maps can help you experiment with different page layouts and element positions. This allows you to perform meaningful tests, such as changing the location of CTAs and links and exploring which variation gets the most clicks. Because of this heat mapping also has great synergy with A/B Testing.
3. Identifying problems
Heat maps can help you identify issues on your website by drawing immediate attention to them. They can highlight areas that aren’t getting enough engagement. This could be your main CTA, product links, or even vital elements such as your Basket/Checkout options. You can ask yourself questions such as:
- Is this CTA getting as many clicks as it should be?
- If people aren’t clicking on what I expected, where are they clicking and why?
- Are visitors scrolling through less important content (such as images or white space) and leaving before they reach the most important content?
Heat maps can help you spot both existing and potential issues for your website. If you find any, get them fixed!
4. Visualising numerical data
Heat maps can help you visualise numerical data, such as click and bounce rates. This is a great alternative for many people who would rather not sit and read spreadsheets of tables and data. As a result, heat maps are also very suitable for presenting this data in a way that’s easy to manage and to highlight key points quickly.
5. Complementing other tools
Heat maps complement other analytics and tracking tools. As mentioned above they work great with A/B testing, but also other tools such as Google Analytics where metrics and objectives can be measured and help you thoroughly understand the behaviour of your visitors.
Get started with Heat Maps
In conclusion, heat maps are a powerful tool for understanding your website visitors and improving website performance. By using heat maps to analyse user behaviour, you can make informed decisions about how to improve your website and increase user engagement. If you’re not already using heat maps, it’s definitely worth considering!
If you need help getting started with heat maps, check out our Heat Mapping page or contact us for a chat about how we can help you improve your own website performance.