Google Analytics 4 comes with a number of interface upgrades compared to Universal Analytics, particularly when it comes to reporting. Learn how to customise your reports in GA4 to better understand how your website and digital marketing efforts are performing.
Report Navigation
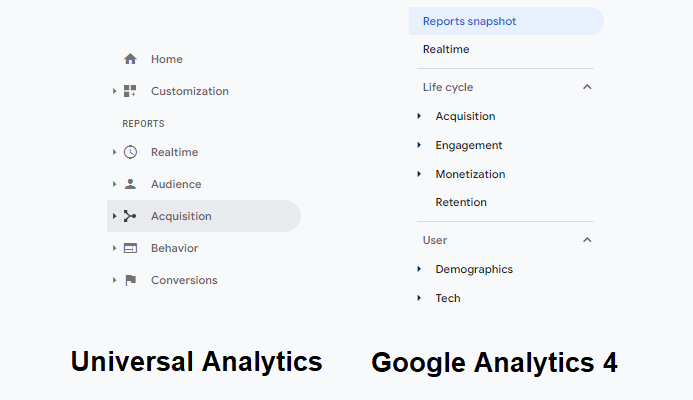
The Google Analytics 4 reporting interface can be quite a shift if you have been used to using Universal Analytics. While some reports are the same, others have been moved and many reports have been adjusted completely to work with the new underlying event structure.
However there are options available to customise not only your own reports, but many of the existing default reports as well. Reports can even be grouped into sections, allowing you to create collections of reports for different interests of your online business.
You are able to build your own reports and collections, from detailed metrics to general overview reports that act as a dashboard for your online business.
This is possible through the Report Library in Google Analytics 4. It is a tool that allows you to build reports from scratch, or make use of community templates and import reports directly into Google Analytics 4. This is similar to how Custom Reports work in Universal Analytics, though GA4 does have some additional features.
Customising Reports & Collections
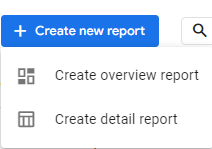
When creating a report, there are two main types available in Google Analytics 4. Overview and Detail reports. They both have access to the same data, but do display information differently.
Overview Reports
Similar to Dashboards from Universal Analytics, an Overview Report is a collection of information cards, each housing a dimension and a couple of metrics. The purpose of the Overview Report is to provide you with information at a glance. As reports in Google Analytics can be shared, the Overview Report is ideal for presenting a top level review of online performance in that area of the business.
Detail Reports
These reports may seem significantly more familiar if you have used Universal Analytics before. Detail Reports are traditional reports that can include up to 2 charts to help visualise the data. They also include a table that includes dimensions and a variety of metrics to give an in-depth view of performance.
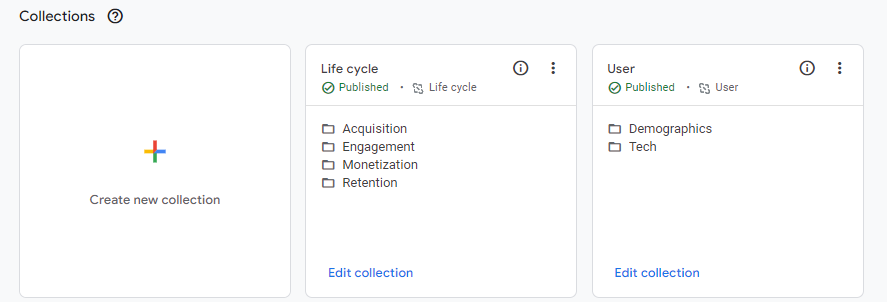
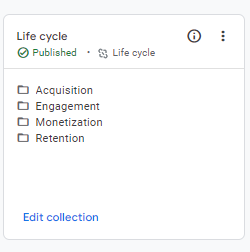
Together these reports can be combined into a Collection, a grouping of reports for a specific aspect of the business. By default, Google Analytics 4 comes with just a few Collections, the Life Cycle reports and User Reports.
Using the Report Library, it is possible to customise these existing default reports, as well as build your own reports to add into Google Analytics 4. Building your own report from scratch may sound tricky, but as long as you know what information you want, it is fairly straightforward, both for Detail and Overview Reports.
Building a Detail Report
Detail Reports are very similar to traditional Universal Analytics reports. Each report has the option to include up to 2 charts, along with a choice of dimensions and metrics to report as a table of data. The visual functionality is quite limited, but this is because individual Detail Reports are designed to be as concise as possible. Multiple reports can be combined into a single Overview Report in GA4 to provide you with a quick access dashboard to the information you need.
Creating a new Detail Report will present you with a few options to create a new blank report from scratch, or to use an existing template.
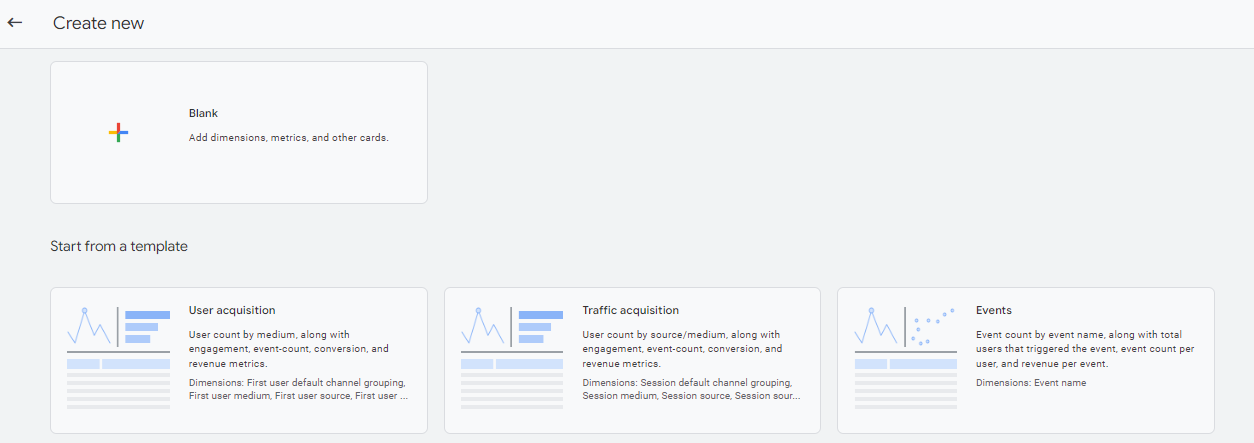
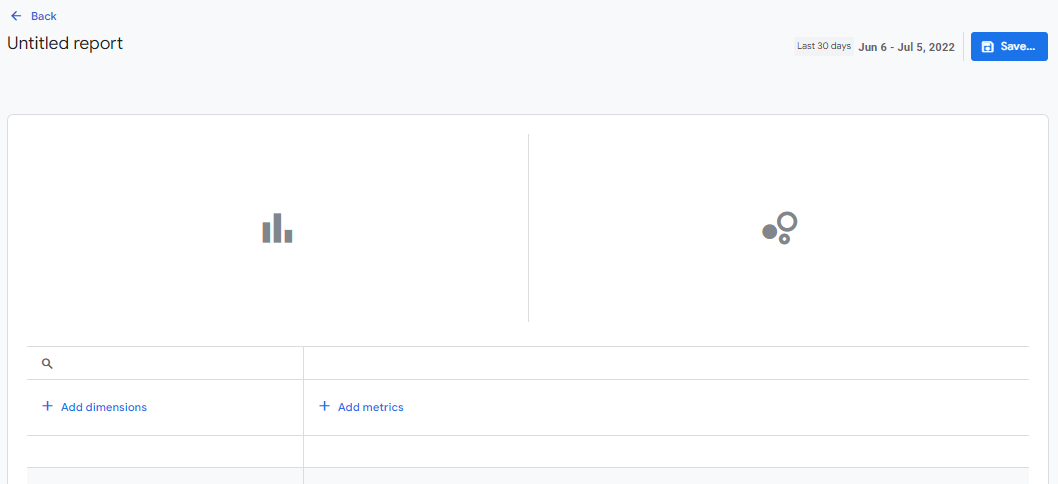
Selecting a new blank report will open the report editor. You will see that you have a fairly basic layout, consisting of a table for your dimensions and metric data, along with 2 charts.
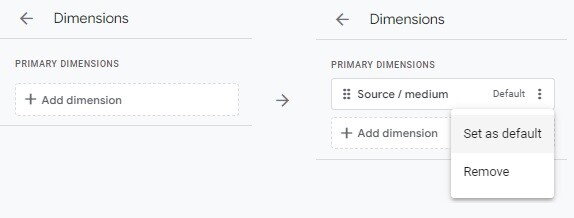
To get started, begin by adding a dimension of your choice, which will usually be the main focus of the report. If adding multiple dimensions, you can select the 3-dot dropdown on the side to set which dimension you want to be the default choice for the report.
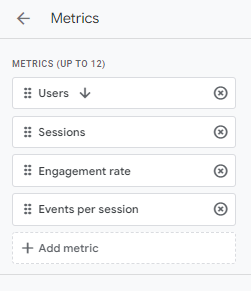
After you have picked your dimension(s), select the metrics needed for the report. These will be the measurements of data attributed to the dimension. We have a blog post explaining all about metrics if you need more information on what to choose.
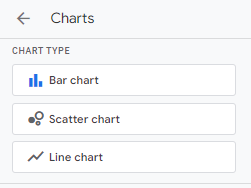
To display your data visually, you have the option to add up to 2 different charts. Choices are quite limited and at the time of writing, there are only 3 options available, a bar chart, line chart or scatter chart, available in Google Analytics 4.
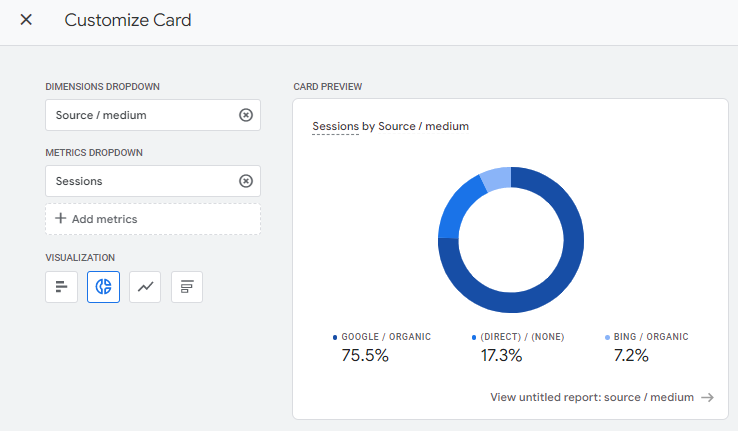
To make use of your Detail Reports within Overview Reports, you can add Summary Cards as well. If you don’t plan to use your Detail Report in an Overview Report, you can safely skip this part. Adding a Summary Card will offer the dimensions and metrics within your report along with a choice of visualisation to show the data as a single snapshot.
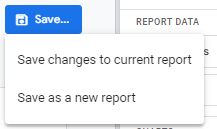
Once your report is complete, be sure to name and save your new Detail Report before closing the window or returning to Google Analytics 4.
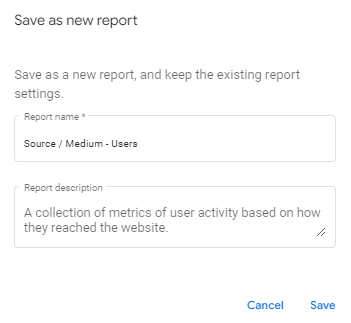
Additionally, if you’re editing an existing report, you can also save the report as a new one or save the changes to the existing report.
Building an Overview Report
Overview Reports are constructed by creating a set of information cards that pull data from your Detail Reports or the standard Google Analytics 4 reports. Each Overview Report can have up to 16 cards highlighting different dimensions and metrics to give you a quick and easy method of showing data.
Creating a new Overview Report will initially give you a rather blank looking window, with the option to name your report something a little more exciting.
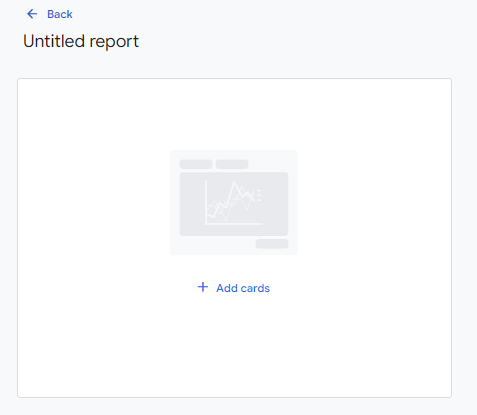
Selecting the “Add Cards” option, either in the main window or in the side panel, will present you with a selection of existing cards. Note that there are two tabs here.
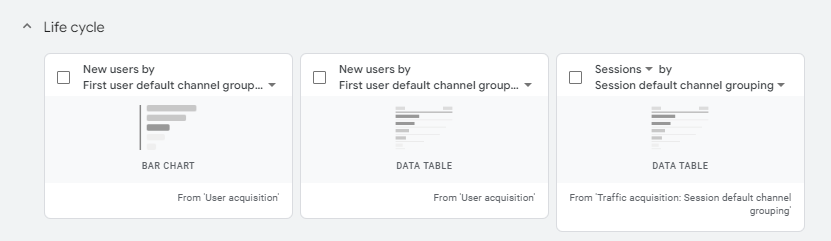
Summary Cards
These cards are pulled from your Detail Reports. If creating an Overview Report based on a collection of Detail Reports, these cards will likely contain the dimensions and metrics you want to display.
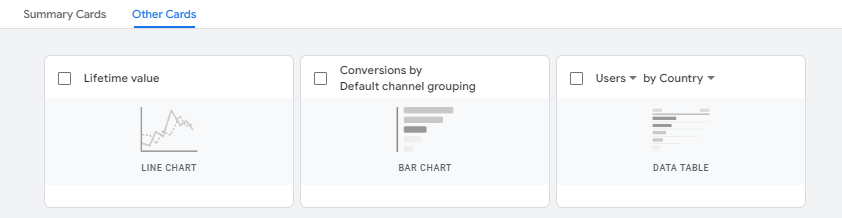
Other Cards
If you wish to include other information, other cards are standard reporting cards available within Google Analytics 4. They often contain some basic information, which can be used to compliment a general overview of your Detail Reports.
When selecting a card you do not need to use the default dimensions and metrics shown. If the card contains a drop down arrow, you can select the precise information that you want to include within the card.
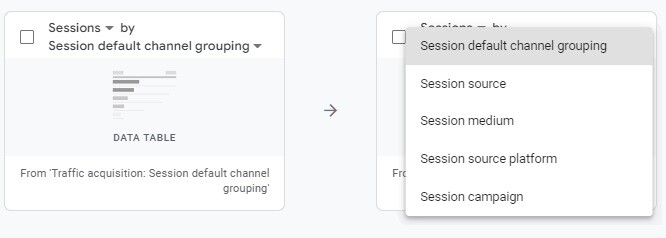
By combining a collection of cards together, you can create an effective reporting dashboard in Google Analytics 4 for your own custom collection of reports.
Report Library Templates
Much like Custom Reports in Universal Analytics, the Report Library provides a variety of report templates that can be used to quickly make a new report collection, depending on your requirements.
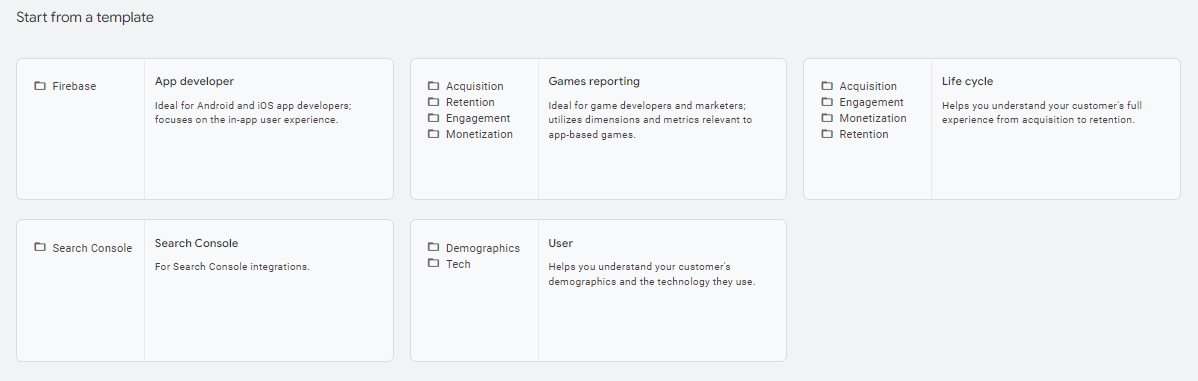
Linked Reports in Google Analytics 4
Some reports within Google Analytics 4 can be linked to Google-defined reports (such as the default reports). Linked reports will automatically receive updates if Google decides to roll out an update to one of their own reports.
Any reports you create completely from scratch will be unlinked, however by default, using a template will automatically link your newly created report with associated Google reports and can be updated. Your own changes won’t be affected, but if you would prefer to have 100% control over your reports, you do have the option to unlink them.
To unlink a report that you have created, click on the Unlink option in the report builder. You can also unlink an entire report template completely if you do not want the template to receive updates from Google.
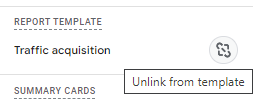 To do so you can select “Unlink” next to the name of the report template.
At the time of writing unlinked reports and templates cannot be re-linked, so be careful if you choose these options.
The future of reporting in Google Analytics 4
With Universal Analytics officially sunsetting in about a year from now, we can expect that the reporting features of Google Analytics 4 will continue to expand and be developed over time. Hopefully this will help you get started navigating and tweaking your own reports. There is also Exploration Reports, but that’s a little more technical, and something we’ll tackle in a separate blog post. Feel free to dive in and start setting up your own reports as the best way to learn the Google Analytics 4 interface is to use it often. Doing so will help you gain a better understanding of the performance of your online business.
If you would like some assistance with getting Google Analytics 4 set up, don’t hesitate to get in touch with us today.