Posting on social media, sending emails, running paid ads, writing blog posts, adding images, offline events, COVID-19? There are so many activities and events that could influence the performance of your website and conversions. Tip 13 is about using the Annotations feature of Google Analytics to keep track of those activities.
To keep up with all 31 tips, visit the full list here, or join the newsletter for a weekly summary email, or follow us on your preferred social channel: LinkedIn, Facebook, Twitter, Instagram, Pinterest or subscribe to our channel on Youtube.
What are Google Analytics Annotations?
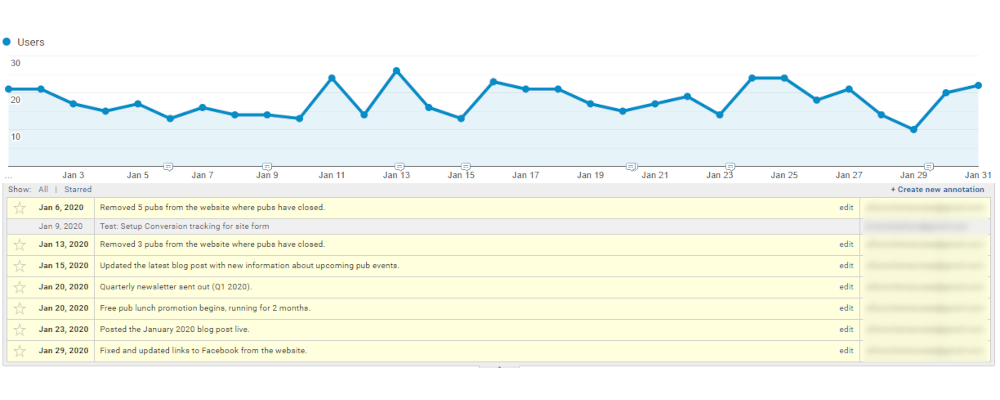
Annotations are simple to use notes that you can add to charts within Google Analytics. They can be up to 160 characters long, are assigned to specific dates and, when created, appear as little speech bubbles along the foot of your charts.
It doesn’t matter which report you are viewing in Google Analytics when you add an annotation. The annotation will appear across every Analytics report.
How can Annotations help?
There are a lot of moving parts in any digital marketing process that could directly impact the performance of the business website. That performance can also be impacted by offline events, technical changes and more.
Website performance aside, there may also be a lot of digital marketing activity going on … social promotions, mailshots being sent, paid ad campaigns, content writing to improve SEO.
Is someone keeping track of when all those things happened?
Annotations within Google Analytics are a quick and easy way to take note of all that activity. Using them means you have a timeline of events which you can refer to going forward, rather than having to dig through emails, ask a colleague or simply forget the dates.
Being assigned to dates, and being noted within Google Analytics, means you can also see how website performance changed as a result of that activity.
Seeing spikes in traffic volume, or drops in conversions? You might be able to relate them back to a specific annotation, which in turn might help you narrow down the cause.
What annotations should you add?
Our recommendations is to add anything that could positively or negatively impact business performance, particularly online performance. That could include:
- Notes on any technical changes to the website: Did you change hosting? Add SSL Certificates? Optimise images to address site speed. (See Tip No. 08!)
- Notes on content changes on the website: Did you change the navigation menu? Did you add new service pages or product pages? Did you add a new blog post?
- Notes on paid Ads activity: Did you start or stop any paid ads on Facebook, Google Ads? Did you make changes to ads to improve their performance?
- Notes on Email Marketing campaign sends.
- Notes on site changes aimed at improving organic search ranking?
- Notes on offline events which could impact the business: COVID19, Brexit Announcements, environmental.
- Industry specific offline events: conferences attended, industry regulation changes, etc.
There is some activity we’d draw a line at. Adding an annotation every time you tweet for instance, if you tweet multiple times per day.
That’s going to be self-defeating, with so many annotations being added daily that the point of having a readable timeline is lost.
[templatera id=”3898″]
How do I add annotations in Google Analytics?
Easily! Visit any chart in Google Analytics. If you don’t have Google Analytics setup, refer to Tip No. 01 in our series.
Once viewing a chart, click on the triangle below the chart, and a small section will open with a link to “Create a new Annotation”. Click it and you’ll see the 160 character box.
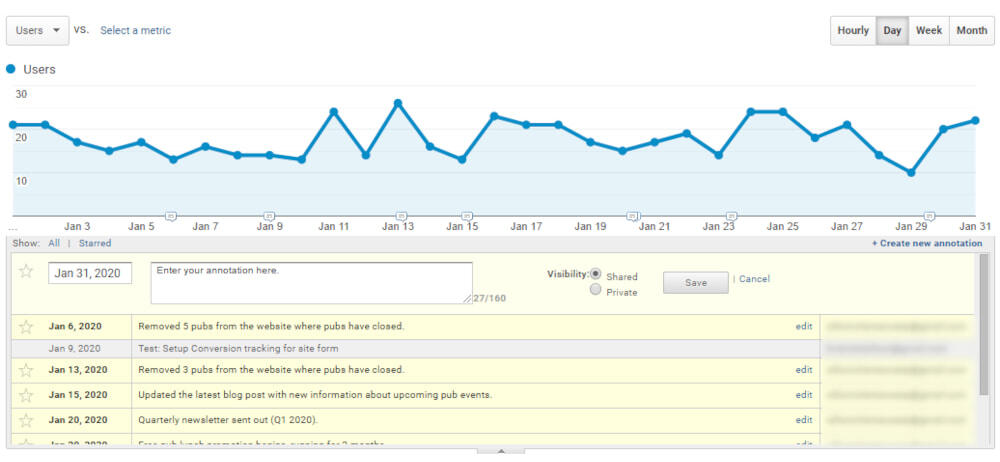
Type something, select a date and save. A small speech bubble should appear on the chart. If you browse to any other report now, you should see you that same speech bubble.
If you click on any annotation, a new section loads, highlighting the note relating to the annotation you clicked.
Browse all 31 tips
To catch up on all 31 Digital Marketing Tips from this series, head over to the main blog post.