Trying to understand where you rank in Google? It’s impractical to manually check, searching yourself from time to time. You’ll only try a few terms, and you’ll probably only scroll to pages 3-4 of search results. Tip 22 is all about getting more detail and greater depth of keyword insights by using the Search Console Queries report.
To keep up with all 31 tips, visit the full list here, or join the newsletter for a weekly summary email, or follow us on your preferred social channel: LinkedIn, Facebook, Twitter, Instagram, Pinterest or subscribe to our channel on Youtube.
What is Search Console?
If you’ve followed our series of tips so far, tip no. 6 (Ensure Search Console is Setup and Running on your website) described the importance of Search Console, what it does and how to set it up.
We recommend you cover Tip no. 6 first, if you’ve not already done so.
If you did watch / read tip no 6, and managed to setup as per the description, you’re hopefully in a situation now where Search Console has started collecting data.
[templatera id=”3898″]
What is the Queries report in Search Console?
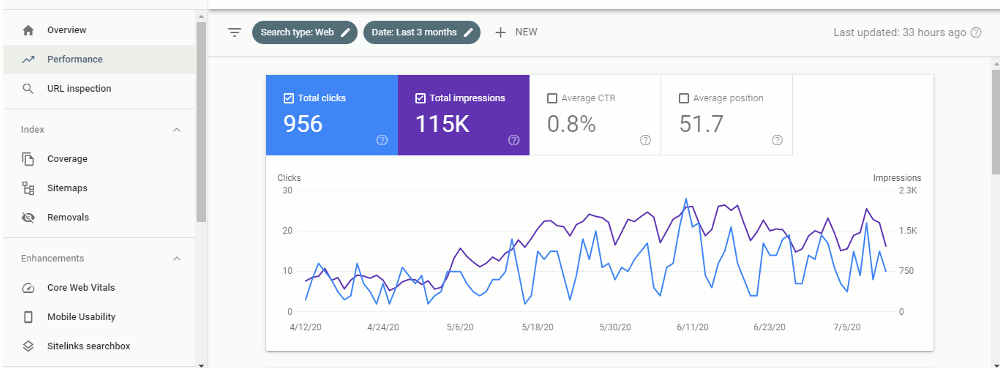
Assuming you do now have access to Search Console, login to it and navigate to “Performance” in the left side menu. You should see a line chart with selection checkboxes for Total Clicks, Total Impressions, Average CTR and Average Position.

This chart offers insights into how those metrics have changed over time, whether they’ve improved or gotten worse. You can change the date to cover a period as far back as the last 16 months.
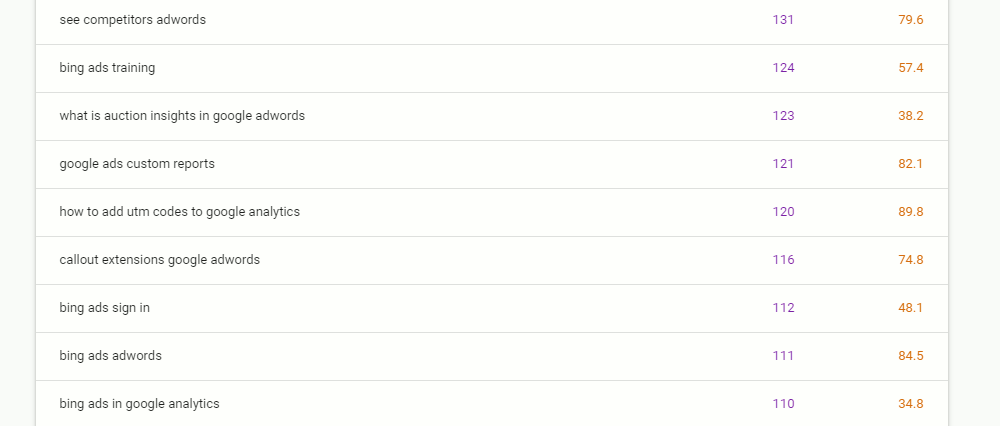
Below this chart is a table. This first tab in this table is titled “Queries”, and it contains the search queries that users typed into the Google search engine. The columns to the right reflect the checkbox selections from the chart above.
For each search query in the report, you can see total clicks generated, total impressions generated, average CTR from that search query and average position in which your website ranked when the user searched for that query.

How can we use this search query data?
The search query report can often be an eye opener. Displaying up to 1000 search terms entered by users, along with various filtering options, the report can be used to:
- Better understand the variances used when people search. You’ll quickly see there are multiple ways to describe one single product or service.
- Discover the secondary terms being used while people search (locations, times, price related etc)
- Understand the questioning nature of search, with the volume of “what is”, “where to”, “how do” etc search terms used by searchers.
- Realise whether your impressions, rankings and volume of keywords ranked for have grown or reduced over time.
- Get insights into whether there is seasonality in how people search for the products or services you offer.
This insight can then be used to develop the content on your website. With this new insight, you might consider:
- Tweaking the meta title on some of your pages to ensure the most commonly searched (and relevant) terms are included in it.
- Review on-page titles to ensure they better align to what users are actually typing into search engines.
- Upgrade some of the body text, ensuring you include some of the variants used by users when searching.
- Brainstorm potential new blog / article content, based on grouping relevant search queries.
It of course doesn’t have to focus solely on the website and organic rankings. You could also used this data to:
- A/B Test subject lines of your marketing emails. Testing what you’d typically use alongside variations used by searchers.
- Use Google Ads to test potential click volume of search queries for which you currently rank in the lower pages of Google.
- Consider Social Media campaigns around topics that appear popular amongst searchers.
Take notes!
While reviewing the search queries report, take notes. Have a pad and pen near you, or open a spreadsheet. You may find there is a lot of data within your Search Console account, and so we recommend taking notes of similar keywords.
Group them into themes and topics, and you’ll gradually get a clearer idea of how your site is performing organically.
Browse all 31 tips
To catch up on all 31 Digital Marketing Tips from this series, head over to the main blog post.


